GALLERY |
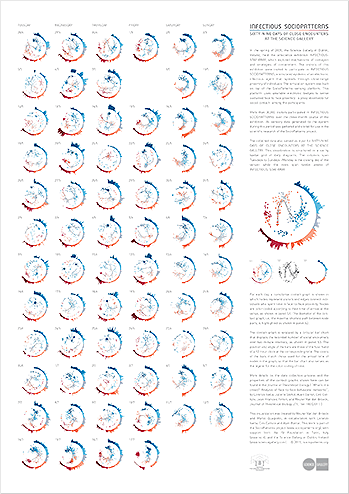
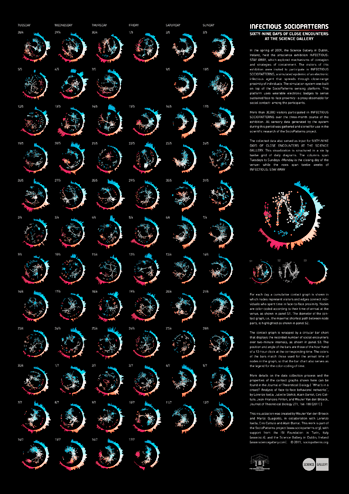
This gallery offers a collection of visualizations, pictures, movies and other media created and/or recorded in the context of the SocioPatterns project. The most recent entries are shown below. Use the menu on the left to browse the rest. Subscribe to the Gallery RSS feed to be notified of new entries. Dynamical Contact Patterns in a Primary School Aug 16, 2011This movie represents the dynamical contacts network measured during one day of activity in a primary school. Nodes represent individuals, and edges indicate face-to-face contacts. Every frame shows the contact network over a time window of 20 minutes. Nodes are arranged in groups that correspond to the school classes, with the teacher node at the center. Nodes are color-coded according to the grade and teachers are shown in black. Credits: Alain Barrat and André Panisson. SocioPatterns movies Sep 15, 2009Over the years we have published a number of movies that visualize data collected with the SocioPatterns sensing platform. We collected them here on one page, accompanied with links the original posts in which they were published. Live Social Semantics, part 1More details are provided in the original post. Contact Patterns part 2More details are provided in the original post. Contact Patterns part 1More details are provided in the original post. Credits: Wouter Van den Broeck. Infectious SocioPatterns Poster Feb 16, 2011In the spring of 2009, the Science Gallery in Dublin, Ireland, held the artscience exhibition INFECTIOUS: STAY AWAY, which explored mechanisms of contagion and strategies of containment. The visitors of this exhibition were invited to participate in INFECTIOUS SOCIOPATTERNS, a simulated epidemic of an electronic infectious agent that spreads through close-range proximity of individuals. The simulation system was built on top of the SocioPatterns sensing platform. This platform uses wearable electronic badges to sense sustained face-to-face proximity –a proxy observable for social contact– among the participants. More than 30,000 visitors participated in INFECTIOUS SOCIOPATTERNS over the three-month course of the exhibition. All sensory data generated by the system during this period was gathered and stored for use in the scientific research of the SocioPatterns project. The collected data also served as input for SIXTY-NINE DAYS OF CLOSE ENCOUNTERS AT THE SCIENCE GALLERY. This visualization is structured in a six by twelve grid of daily diagrams. The columns span Tuesdays to Sundays –Monday is the closing day of the venue– while the rows span twelve weeks of INFECTIOUS: STAY AWAY. For each day, a cumulative contact graph is shown in which nodes represent visitors and edges connect individuals who spent time in face-to-face proximity. Nodes are color-coded according to their time of arrival at the venue, as shown in panel S1. The diameter of the contact graph, i.e., the maximal shortest path between node pairs, is highlighted as shown in panel S2. The contact graph is wrapped by a circular bar chart that displays the recorded number of social encounters over two-minute intervals, as shown in panel S3. The position and angle of the bars are those of the hour hand of a 12-hour clock at the corresponding time. The colors of the bars match those used for the arrival time of nodes in the graph, so that the bar chart also serves as the legend for the color-coding of time. The composite daily graph is shown in panel S4.
More details on the data collection process and the properties of the contact graphs shown here can be found in the Journal of Theoretical Biology [ “What’s in a crowd? Analysis of face-to-face behavioral networks”, by Lorenzo Isella, Juliette Stehlé, Alain Barrat, Ciro Cattuto, Jean-François Pinton, and Wouter Van den Broeck, Journal of Theoretical Biology 271, 166-180 (2011) ] Created by Wouter Van den Broeck and Marco Quaggiotto, in collaboration with Lorenzo Isella, Ciro Cattuto and Alain Barrat, with support from the ISI Foundation in Turin, Italy, and from the Science Gallery in Dublin, Ireland. |
![SocioPatterns [logo]](http://www.sociopatterns.org/wp-content/themes/sp2/images/header_logo.png)


