Following up on the success of the Live Social Semantics experiment at the European Semantic Web Conference 2009 in Greece, we will deploy a new experiment at Hypertext 2009 in Torino, from Monday 29th to July 1st. HT09 attendees will be able to experience an application that mashes up real-world social contacts and on-line friendships and interests, in real time.
NEWS
Live Social Semantics at HT09Published on: Jun 27, 2009
Posted in News
Tagged browsing, conference, ht09, rdf, semantic, semantics, serendipity, social, web
Comments Off on Live Social Semantics at HT09
This weekend: SocioPatterns workshop in DublinPublished on: Jun 12, 2009
If you already know a thing or two about Adobe Flash/Flex, Processing/Python or SuperCollider/Max/MSP, and you want to seize this unique opportunity to apply your skills in a two-day ‘Hack-a-Thon’ workshop to visualize/sonorize the SocioPatterns data stream at the Science Gallery- this is the workshop for you! This event is a hands-on exploration of possible ways of visualizing and/or sonorizing the live data-stream from the SocioPatterns deployment in the INFECTIOUS exhibition. In addition, you may be able to apply your own Arduino magic given the live data feed from the SocioPatterns deployment at the gallery by using Open Sound Control signals which Arduino can receive when connected to the network or over Wireless or Bluetooth. Arduino can, given these signals, do all kinds of stuff, like triggering blinking lights. Basic libraries for tapping into the live data stream for each of these platforms will be provided. During the workshop, participants will be able to tap into the live data stream from the SocioPatterns deployment at the Science Gallery. Given that the participants will only have access to the live stream during the workshop, the idea is to have finished pieces by the end of the workshop. It is necessary that all participants think about what they want to do beforehand, and even pre-develop basic artwork to be used during the workshop. This workshop is free, but you need to reserve here (hurry, because we’ve heard that there are only a few places left…)
Posted in News
Tagged Adobe AIR, Arduino, Dublin, Flash, Infectious, Max/MSP, Processing, Python, RFID, Science Gallery, sonorization, SuperCollider, visualization
Comments Off on This weekend: SocioPatterns workshop in Dublin
Triple deploymentPublished on: Jun 4, 2009
We’re proud to announce that today we had three simultaneous SocioPatterns experiments successfully up and running in three different countries. One experiment has been running for more than six weeks at the Science Gallery in Dublin, Ireland, the second has been running for the last couple of days at the European Semantic Web Conference conference in Heraklion, Greece, and the third started today at the 20ème Congrès de la Société Française d’Hygiène Hospitalière in Nice, France.
Posted in News
Comments Off on Triple deployment
Upcoming SocioPatterns experimentsPublished on: May 24, 2009
We have three new SocioPatterns experiments in the pipeline. The first will be deployed at the European Semantic Web Conference from May 31st to June 4th, in Heraklion, Greece. This deployment will focus on the integration of the real-time social interaction data with semantic data on the on-line social networks of the participants. The second will be deployed at the 20ème Congrès de la Société Française d’Hygiène Hospitalière on June 4th and 5th in Nice, France. This deployment aims to demonstrate the SocioPatterns platform and its ability to collect highly detailed data on the social interactions in a large-scale setting. The third experiment will be deployed at the ACM Hypertext 2009 conference from June 29th to July 1sr, at Villa Gualino in Torino, Italy.
Posted in News
Tagged HyperText, RFID, Semantic Web, social
Comments Off on Upcoming SocioPatterns experiments
SocioPatterns at Infectious in the Science Gallery, DublinPublished on: Apr 23, 2009
Last week we deployed a new SocioPatterns experiment at the “Infectious” exhibition in the Science Gallery at the Trinity College in Dublin, Ireland. The following movie is a teaser for the exhibition. SetupAll visitors of the exhibition get to wear SocioPatterns/OpenBeacon tags during their visit. For this exhibition, the firmware has been enhanced to support a “virtual contagion” process. When visitors enter the exhibition their tags are initially “uninfected”. A tag can get “infected” if the person wearing it spends time in the vicinity of an “infected” person. Infected tags have a different blinking pattern and show up as red marks in the real-time visualization available to the visitors, as opposed to green for uninfected ones. This deployment also features a reactive part that involves audio-visual effects triggered by the proximity of individuals. Various visualizations of either the whole interaction network or contextual subsets, are located throughout the exhibition. The following is an extract from the April 16 journal on the national Irish TV (RTE) that should give you an idea of the exhibition in general and the theatrical framing of the tag distribution process, as well as (the current state of) the alarm effects in the tunnel.
The following video offers a nice overview of the complete exhibition, starting with the SocioPatterns deployment.
Also have a look at the exhibition guide superbly designed to look like a government emergency procedure leaflet. ScienceThis particular SocioPatterns deployment clearly has a high “drama” component to it. It is, however, also scientifically relevant. In particular the fact that it involves a continuous stream of visitors entering and leaving the exhibition is of interest. Such “high-flow” setting is akin e.g. train stations or airports. A better understanding of the structural and temporal nature of social interaction patterns in such high-flow settings is relevant in a number of domains, including epidemiology. Clearly, collecting detailed data on these patterns in an actual train station or airport is very difficult. The relatively controlled and approximating settings of this exhibition does however provides us a promising opportunity to indeed collect such data. While our earlier experiments were deployed at conferences with a relatively homogeneous and stable population, here we have a more heterogenous and dynamic population. We can thus now compare the social interaction patterns in these different settings. We are interested in deploying SocioPatterns experiments in yet other kinds of social settings (proposals are welcome!) The SocioPatterns deployment at the Infectious exhibition includes a “live” simulation of contagious spreading. By framing this functionality as a “game” and controlling the nature of the information that is provided to the visitors in different runs on different days, we hope to collect data on and compare different kinds of behavioral effects. AcknowledgementsThis project has been deployed by Ciro Cattuto and Wouter Van den Broeck in collaboration with the Science Gallery. We would like to thank Michael John Gorman, Don Pohlman and Derek Williams from this great venue for making this possible. We would also like to thank Milosch and Brita Meriac from OpenBeacon.org for once again providing excellent RFID hardware, and the ISI Foundation for their continued support. PicturesTo wrap up this post, we would like to share some pictures taken at the exhibition. 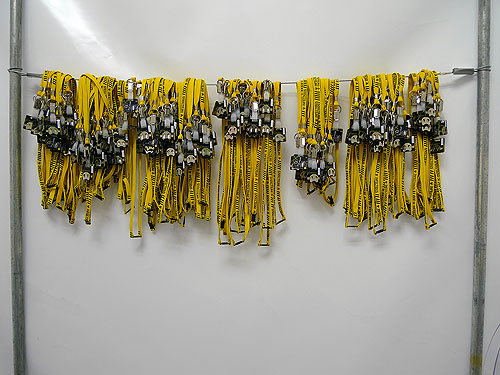 A bunch of RFID tags ready to be distributed at the entrance. 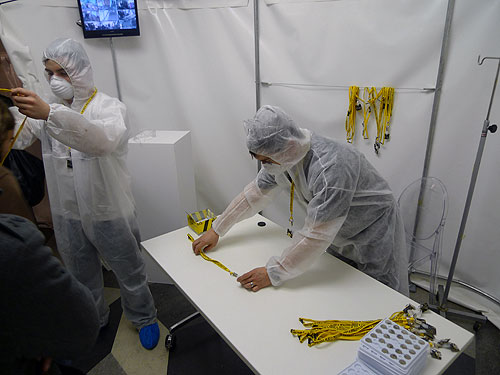 Handing out the RFID tags. 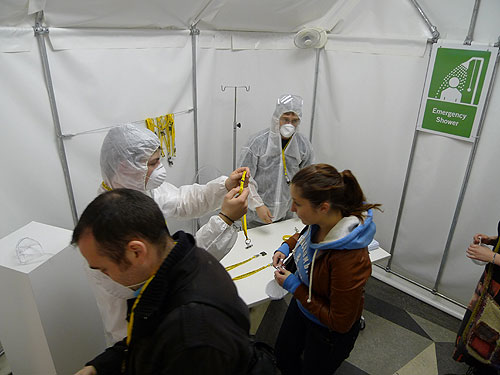 Handing out the RFID tags. 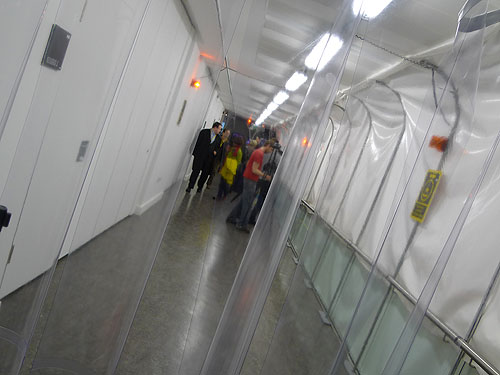 The tunnel contains alarm effects triggered by nearby infected tags. 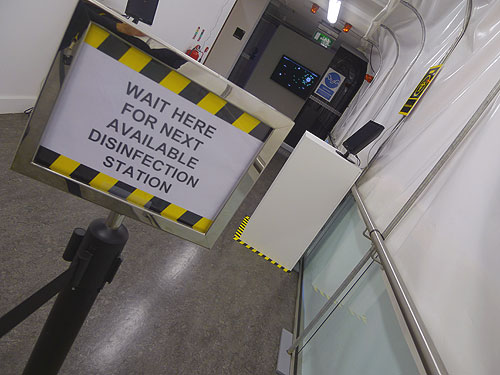 Nearing the end of the tunnel with the disinfection stations. 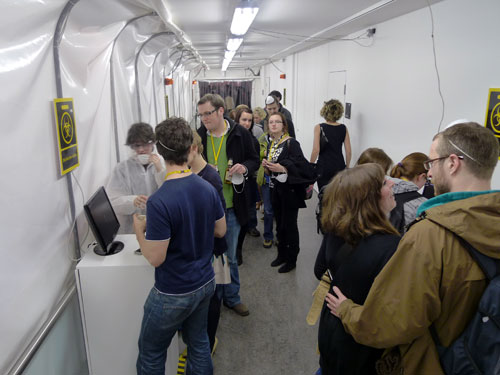 Queuing to get healed at the disinfection stations. 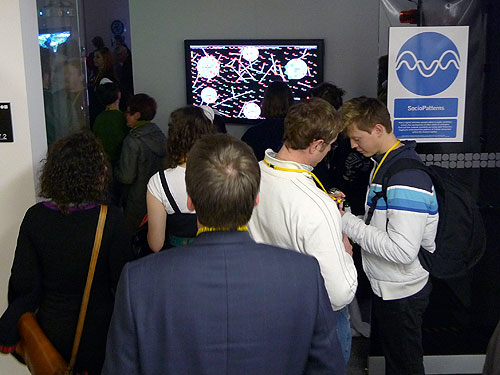 The visualization at the end of the tunnel during the crowded opening event.
Posted in Our projects
Tagged contagious, Dublin, epidemic, Infectious, RFID, Science Gallery, sentinel, Trinity College
4 Comments
|
NEWS |
![SocioPatterns [logo]](http://www.sociopatterns.org/wp-content/themes/sp2/images/header_logo.png)

