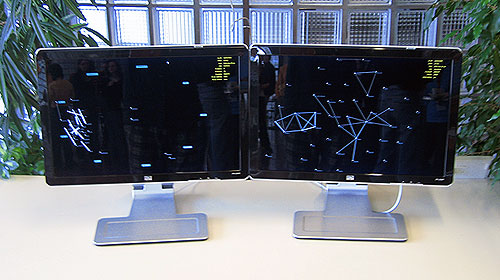
Contact Patterns part 2The following movie visualizes the social interactions between the participants of a recent workshop at Villa Gualino. The visualized data is obtained through a distributed sensing platform. This platform uses active RFID technology to detect “contacts” during which participants are both near each other and are facing each other. If such configuration is sustained for longer than a few seconds, then this generally indicates that some form of social interaction is taking place. Next to the actual contacts, the platform also infers where these contacts take place. An earlier post in this blog provides more details on the technical set-up and the objectives of this project. Note however that we here use the peer-to-peer contact detection scheme detailed in this subsequent post. More details about this are provided in a manuscript available at arxiv.org/abs/0811.4170. What this movie shows is a time-lapsed replay of some sections of a real-time visualization that was publicly displayed during the workshop, shown in the picture below. In this visualization, the RFID stations are represented as immobile labeled marks laid out in an oval configuration. Their labels name the areas in which the respective stations are located. There are two stations in sala A in which the workshop presentations took place, three in the bar next to sala A, two in the cafetaria in which lunch was served, and one in the lobby. The size of the round part of the station marks is proportional to the summed strengths of the signals received from beacons. The publicly displayed visualization. The left screen shows the instantaneous contact network, the right screen shows the cumulative network, which will be discussed in more detail in a future post. The mobile circlets represent the beacons, which are the small RFID devices worn by the participants. Their size is proportional to their strength, which is the sum of the weights of the contacts they are involved in. Their situation in the visualization is controlled by a force-directed layout algorithm. A first set of spring forces are applied between beacons and those stations that are within their radio signal range. Their length and tension is proportional to the strength of the respective signals. Stronger signals, which reflect closeness, are translated in shorter spring lengths and increased tensions. The relative location of the participants with respect to the stations is thus (flexibly) mapped to the abstract geography of the visualization. As the signal strengths change when the participants move around with their beacons, the mapping of their marks will be effected accordingly. A clear example of this is the “migration” of the bulk of the beacon marks towards the bar stations marks during the coffee breaks. A second set of spring forces is applied between beacons that are in contact with each other. These contacts are furthermore explicitly represented as edges. The thickness and shade of these edges, and their spring length and tension, are all proportional to the weight of the contact. The layout system also involves drag forces and n-body repelling forces. Unlike the spring forces, these do not reflect actual information, but solely serve to optimize the layout. The drag forces are applied to stabilize the spring driven movements, while the repelling forces, which are applied between all beacons marks, prevent overlap. Comparing this new movie with the one in the first post clearly shows that the new peer-to-peer scheme produces much more precise contact data. The previous system only used proximity as a proxy for social interactions. However, when for example lots of people are seated in a conference room, then many of them are near each other, even though there is no real social interaction going on. In the old movie this is clearly visible. It shows a highly connected network, almost as if everybody is interacting with everybody else at the same time. While perhaps visually pleasing, it is not a truthful representation of reality. In the new movie on the other hand, there are significantly fewer contact edges. This is because participants now also need to face each other for a contact to be detected. These contacts are therefore a much more reliable proxy of actual social interactions. This seems to be confirmed by the fact that there are now less contacts during the presentations in Sala A than during the breaks, as one would expect, or at least hope for. This particular observation is, by the way, discussed in more detail in the previous post. |
|
![SocioPatterns [logo]](http://www.sociopatterns.org/wp-content/themes/sp2/images/header_logo.png)
