Deployment: SocioPhysics workshop
Sensor infrastructure
For the first experimental deployment of the contact sensing platform we were working on, we aimed to detect temporarily sustained spatial proximity as a proxy observable of social contact. To monitor this observable we used the active-RFID based technology created by the OpenBeacon.org project. This technology involves small electronic badges which emit a radio beacon signal at multiple power levels. This signal consists of a small data-packet that contains the unique identifier of the badge, the power level at which it was emitted, and a packet counter. Note that this configuration did not yet use the more advanced communication scheme that was later developed for the fully-fledged SocioPatterns sensing platform.
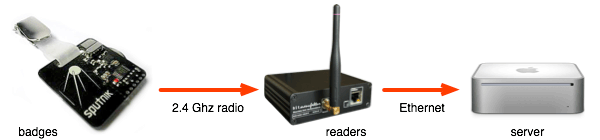
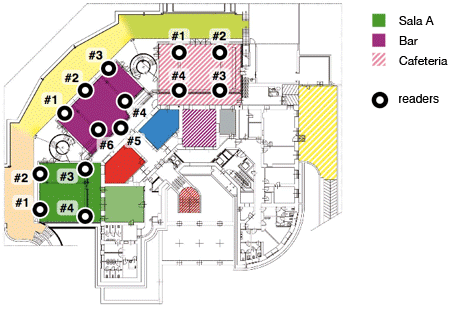
A large amount (relative to subsequent deployments) of RFID readers were installed in the various public areas used by the workshop attendees. These readers listened for the data packets emitted by the badges, and, upon reception, sent a reception report including the original packet to the server.
The packets from up to 50 badges were collected continuously for about 75 hours at an overall rate of up to 100 distinct packets per second. In total about 25 million packets were collected, corresponding to about 200 Mb of compressed raw data.
Reception strength fingerprints
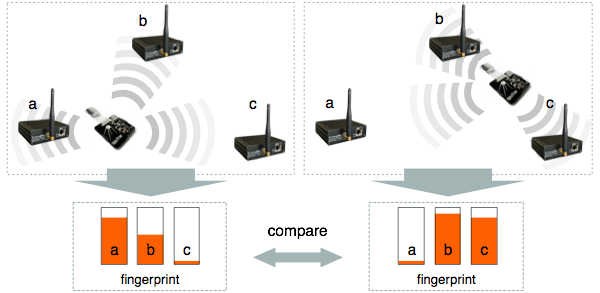
As so many readers were installed, the beacon signals emitted by a badge were typically received by several readers. The aggregation of the beacon reception reports from the various readers enabled the server to produce a fingerprint for each badge for a given period (typically 20 seconds). Such a fingerprint consist of a vector with for each reader a real value that quantifies the reception strength. This value is obtained by looking both at the power level used for the beacon signals received by the respective readers during that period, and the drop rate, which is the rate at which beacon signals that were emitted during that period, were not received by the respective readers.
Given that badges that are physically near each other will have similar reception fingerprints, the physical proximity of each pair of badges can be inferred from the similarity of their respective fingerprints. Alternatively one could infer the locations of the badges through triangulation based on the reception strengths, and compare these locations to infer spatial proximity. However, this approach would use the same signal strength information as we used, but uses the additional step of location inference. Our approach avoid this additional step, as well as the additional errors it entails.
Given the data collected by the system, a dynamic continuously updated network is constructed. The nodes in this network are the participants that are wearing the badges, while the edges represent the inferred physical proximity. All calculations were performed in real-time over a sliding window of about two minutes by the SocioPatterns server, which was entirely coded in Python, using the Twisted framework and the Numpy library.
Visualizing the network
The resulting dynamic network data was stored for subsequent off-line data analysis and investigation, but was also served as a real-time data stream to the visualization application that we developed in the context of this project. This data stream consisted of data structures representing the current state of the network, wich were dispatched on regular intervals by the server over the TCP socket connection to the visualization clients.
The network visualization represents the badges as simple round marks, which are optionally labeled. The readers were represented by labeled marks, laid out equiangularly on a circumcentric oval. The proximity relations are shown as edges. The length, thickness and transparency of these edges is a function of the strength of the proximity: short, thick and more opaque links represent strong –in terms of distance and duration– proximity; thin, transparent links indicate weak proximity. The size of the badge marks is a function of its proximity strength, i.e., the sum of the strength of proximity relations it is currently involved in. The size of the reader marks is a function of the number of beacon signals dispatched through them.
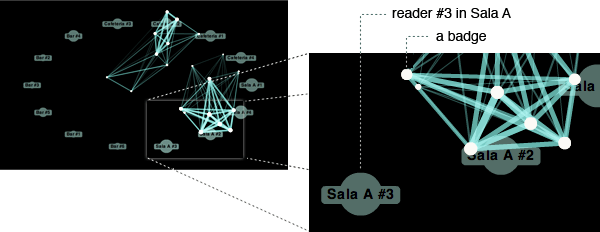
While the readers are laid out at fixed positions, the badges are laid out by using a force-based layout algorithm. Badge marks repel each other to avoid visual overlap, while proximity relations act as a spring force pulling the linked badge marks closer to each other. The stiffness of the spring increases with the proximity strength. Badges are also pulled towards the readers that see them more often, so that groups of nearby badges are laid out in the vicinity of the readers that are closest to them. The result is meant to be a rather abstract yet spatially structured visualization of the proximity dynamics.
Thanks to the real-time proximity detection and processing capabilities of the sensing system, the real-time stream of network updates dispatched to the visualization client, and the dynamic force-directed layout algorithm, we were able to create a real-time visualization of the instantaneous proximity network. This visualization was shown on a publicly displayed screen in the bar area. The following movie shows a time-lapsed playback of this visualization for some interesting periods of one day of the workshop.
A time-lapse playback of the visualization of the proximity network dynamic for some selected periods of one day of the SocioPhysics workshop.
Visualization application
The visualization client was an Adobe Air application developed in ActionScript 3 and Flex. The visualization and physics system used (a mildly modified version of) the flare visualization toolkit.
The application’s interface involved a visualization window, a control panel and a number of auxiliary windows. The visualization itself could be shown full-screen during presentations. The control panel provided various interfaces to manage the data-sources, the visualization and the physics engine.
The data source was either the real-time stream from the server, a simulation for off-line testing, or data files for (time-lapsed) playback. When using a simulation, an additional window was provided in which the simulated readers and badges were shown. When in time-lapse mode, one could activate a frame recorder, which saved a bitmap file for each rendered frame. These saved frames were for example used to create the movie shown above.
Ethical considerations
All data handling was performed in full compliance with the Italian regulations on privacy. All participants were given a paper document with a clear description of the deployment objectives, the technological configuration and the data handling procedures. They were requested to sign this enrollment agreement and consent form before becoming a participant of the deployment.
No records were made of badge-person associations. The data packets were encrypted before being emitted by the badges and were forwarded in encrypted form to the server over a virtual private network. The server on which the data was processed and stored was installed in a secured location.
Conclusion
The technological platform used in this deployment was meant to detect spatial proximity between the badges, as a proxy observable of the non-technologically mediated (NTM) person-to-person interactions we were interested in. It became, however, apparent that this approach suffered two deficiencies. The first is that the fingerprint based proximity inference method was not sufficiently accurate to attain the desired spatial resolution. But more importantly it became clear that co-location is not a sufficiently reliable proxy observable of NTM interactions. Co-location is a pre-condition for NTM interaction (ignoring long-range interactions involving shouting, facial expressions and/or some form of sign language), but co-location does not imply such interaction. We attempted to address these deficiencies in subsequent studies.
During the course of this deployment we experimentally provided a public display of the real-time visualization on a screen in the bar area. The immediacy of this visualization appeared to touch a nerve as it drew an unexpected amount of attention from the participants. This phenomena was further explored in subsequent deployments.
Acknowledgements
- development: Ciro Cattuto and Wouter Van den Broeck
- deployment: Alain Barrat, Ciro Cattuto, Vittoria Colizza, Daniela Paolotti, Jean-François Pinton, Wouter Van den Broeck, and Alessandro Vespignani
- visualisation: Wouter Van den Broeck
- data analysis: Ciro Cattuto
- thanks to: the workshop participants, Santo Fortunato, ISI administration, Ezio Borzani, and Milosch Meriac (openbeacon.org)
- sponsoring institutions:
- ISI Foundation (Torino, Italy)
- Centre de Physique Théorique (CNRS, Marseille, France)
- Laboratoire de Physique de l'École Normale Supérieure de Lyon (Lyon, France)